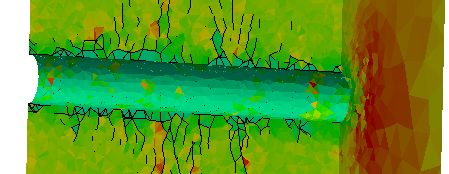
Following up from our previous blog post on 3D FEMDEM Simulations, 3D simulations of a tunnel excavated in a weak rock (resembling properties of a clay shale) are presented here (E=3.8 GPa, ν=0.25, σt=0.41 MPa, c=5 MPa). In this simplified case study, the entire length of the tunnel was excavated at once at the beginning of the simulation. The pressure boundary conditions: σ1=6.5 MPa, σ2=4.5 MPa, and σ3=2.5 MPa were applied along z, x, and y-axis, respectively.
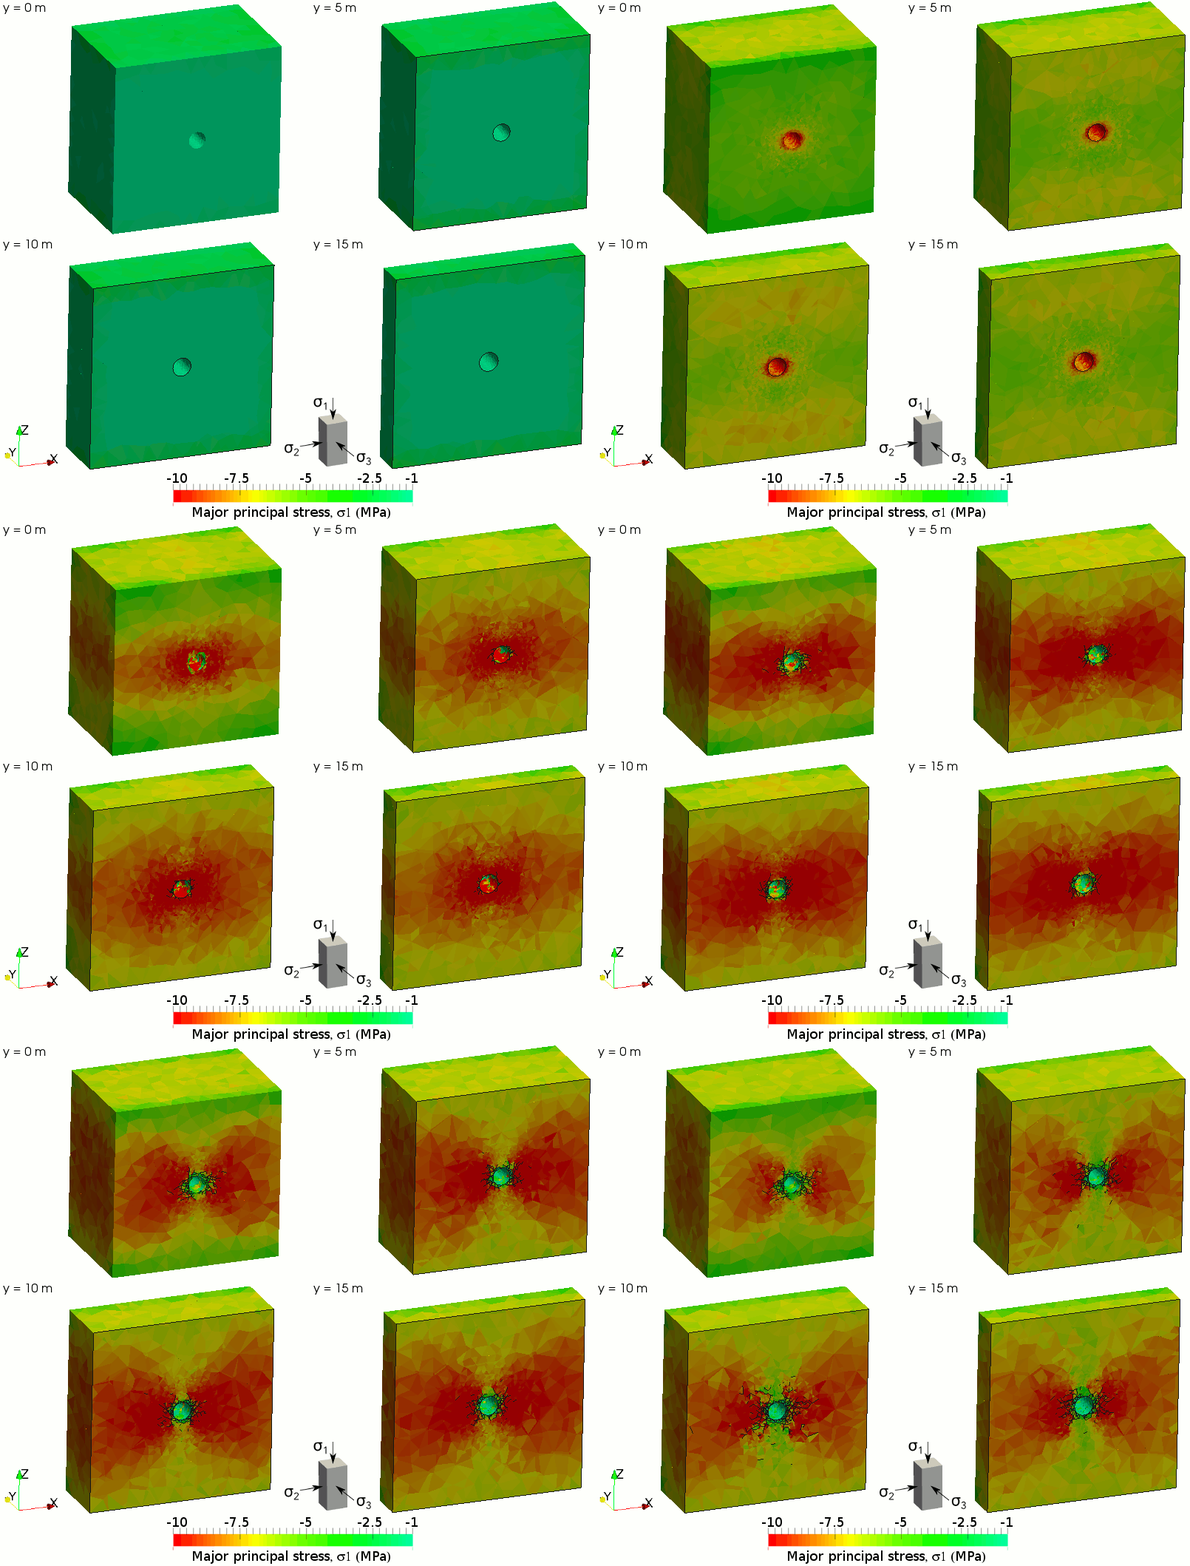
The animation below illustrates the time evolution of the major principal stress, σ1, along with the subsequent fracturing at four different cross-sections along the y-axis. As expected, the highest concentration of compressive stress is simulated in the tunnel sidewalls due to the flow of the maximum principal stress around the cavity. The intensity of these stress concentrations is such that shear fractures start to nucleate and grow from the perimeter of the excavation.
Major principal stress and fracture pattern of a 3D tunnel.
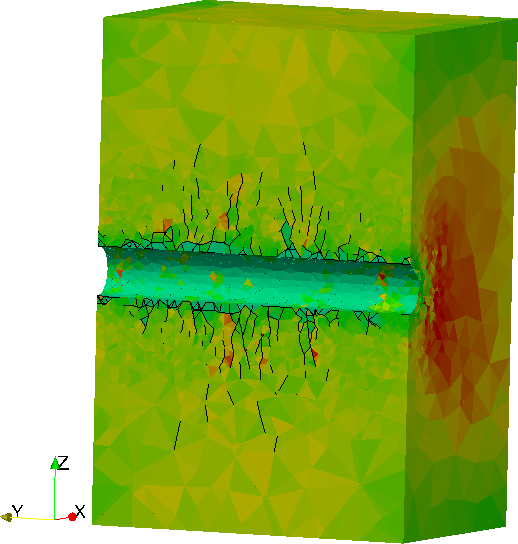
The figure below shows the principal stresses and fracturing pattern for a cross-section along the tunnel. As can be noticed from the figure, three-dimensional effects tend to develop along the tunnel axis with a deeper fractured zone forming in the central portion of the model.
Major principal stress and fracture pattern of a 3D tunnel.
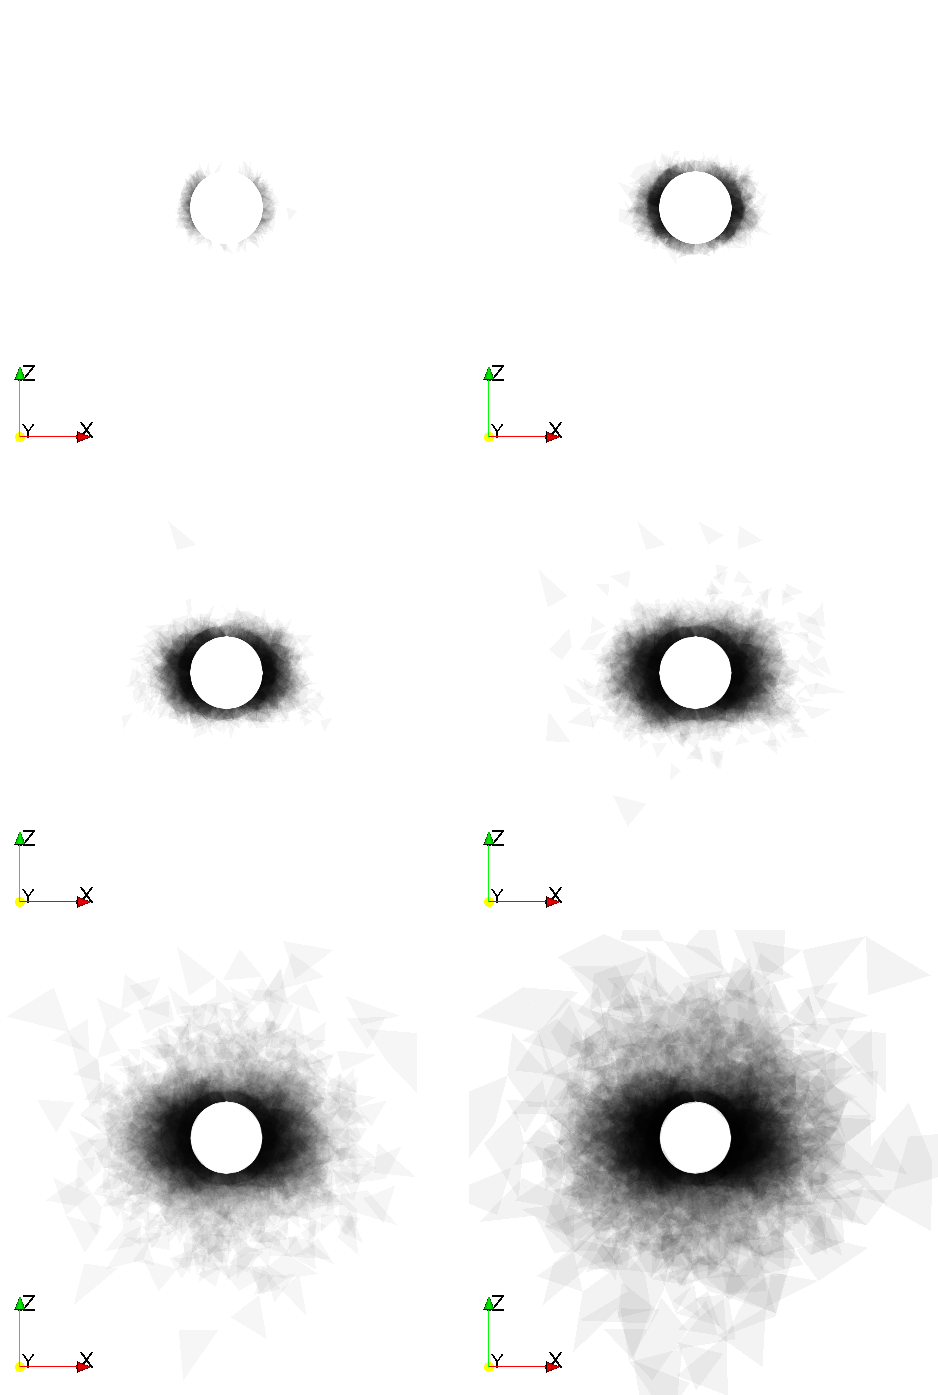
Finally, the fracture volume of the following animation provides a visual estimate of the fracture intensity around the tunnel. Since σ2 was horizontal, most fractures developed close to the sidewalls. Farther away from the tunnel (roof), the fractures were oriented towards σ1. This is mainly due to the application of a non-zero σ3.
Fracture volume intensity of a 3D tunnel.
The next step forward will be to study the effect of excavation staging on the fracturing process, in particular on the tunnel face.


